7. Theory Documentation
During curing of thermosetting composites, the resin undergoes cross-linking reactions that lead to an increase of material density and reduction in volume. A schematic representation of the curing of a thermoset is shown in Figure 1. It traces cure from chain formation and linear growth, through branching and finally to a cross-linked, infinite network. When monomers link into larger molecules they release energy in the form of heat. The exothermic heat of polymerization causes huge problems in processing especially in the case of thick laminates.
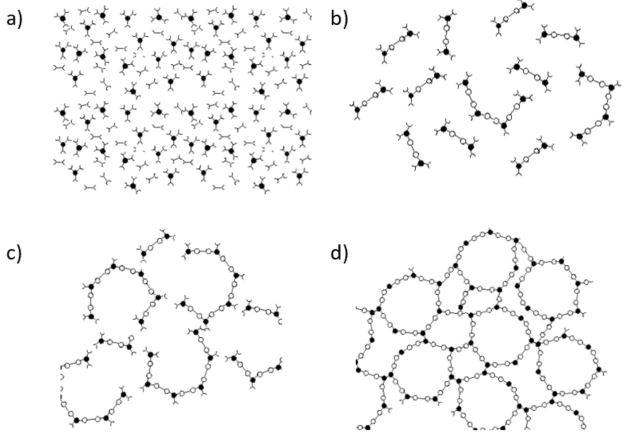
Fig. 7.1: Curing of thermoset resin: a) monomer stage, b) linear growth and branching c) formation of gelled but incompletely cross linked network, d) fully cured thermoset. (From Ref. 1)
7.1. Differential Scanning Calorimetry
Differential Scanning Calorimetry (DSC) is a thermo-analytical technique in which the difference in the amount of heat required to increase the temperature of a sample and reference is measured as a function of temperature. Both the sample and reference are maintained at nearly the same temperature throughout the experiment. Generally, the temperature program for a DSC analysis is designed such that the sample holder temperature increases linearly as a function of time. The reference sample should have a well-defined heat capacity over the range of temperatures to be scanned. The result of a DSC experiment is a curve of heat flux versus temperature or versus time. There are two different conventions: exothermic reactions in the sample shown with a positive or negative peak, depending on the kind of technology used in the experiment. This curve can be used to calculate enthalpies of transitions. This is done by integrating the peak corresponding to a given transition. The heat flow is measured as a direct function of time or of the sample temperature. This data provides extremely valuable information on key physical and chemical properties associated with thermosetting materials, including:
Glass transition temperature (T_g)
Onset and completion of cure (α^0 and α^∞)
Total heat of cure (H_R)
Heat capacities (C_p)
Different cure kinetics models are available in ACCS. These have been obtained by empirical fitting of the data obtained through differential scanning calorimetry. The tests were performed by LMAT Ltd.
7.2. Cure Kinetics Equations
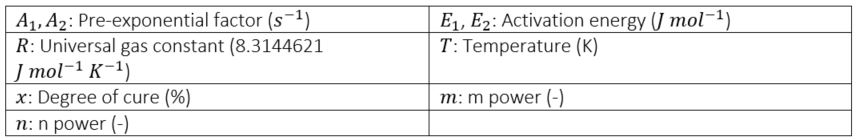
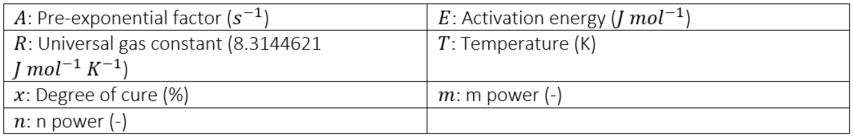
7.2.1. Nth Order

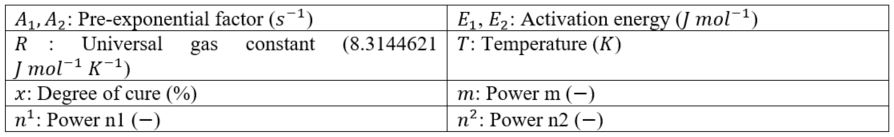
7.2.3. Kamal Sourur
7.2.4. Avrami-Erofeev
7.2.5. Karnakas-Partridge

7.2.8. Released Heat

7.2.9. Glass Transition Temperature

7.3. Viscoelasticity
ACCS can take into account viscoelasticity during curing. They are defined for each state and on the stiffnesses of the three normal and the three shearing directions.
7.3.1. Maxwell Model
Effective stiffnesses:

Viscoelastic increment:
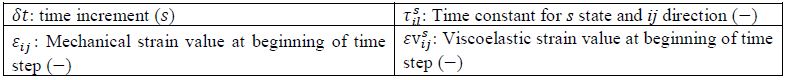
7.3.2. Prony Series
Effective stiffness’s for each terms (u):

Visco-elastic strain increment:
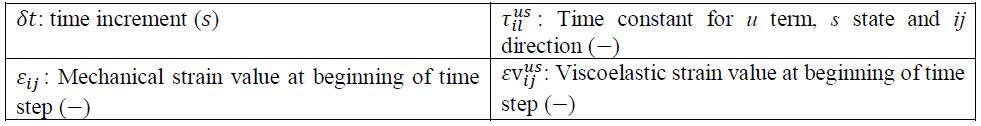
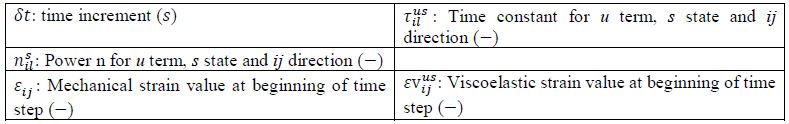
7.3.3. Extended Standard Non-Linear Series
Effective stiffness’s for each terms (u):

Visco-elastic strain increment:
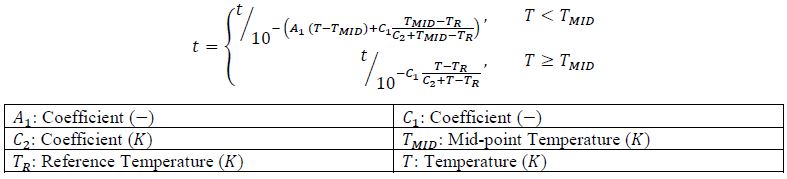
7.3.4. Temperature Time Shift

7.3.6. Cure Shrinkage

The user can only provide directional cure shrinkage strains. The cure shrinkage is scaled linearly with the degree of cure 𝑥.
7.3.7. Crystallization
PEEK
Released Heat

The implementation of the PEEK material model is based on the work published in the following scientific article:
Velisaris, C.N. and Seferis, J.C. (1986), Crystallization kinetics of polyetheretherketone (peek) matrices. Polym Eng Sci, 26: 1574-1581. doi:10.1002/pen.760262208
7.4. Material Model
There are generally two main transitions that can be identified during the curing process of a thermosetting resin. The first one is gelation occurring at approximately 30% - 50 % degree of conversion and the second one is vitrification occurring when the current temperature becomes lower than the glass transition temperature (𝑇𝑔). Gelation is an irreversible process and corresponds to the formation of a 3-D infinite network of polymer chains. Vitrification occurs once the current temperature becomes lower than the glass transition temperature (𝑇𝑔) and the resin transforms from the rubbery to the glassy, or solid, state. Vitrification is reversible and when the material temperature exceeds 𝑇𝑔, the epoxy transforms back from the glassy to the rubbery state.
In thermoplastics there are generally two main transitions that can be identified during the curing process. The first one is crystallization occurring when the current temperature becomes lower than the glass transition temperature (T_g) and the second one is melting occurring when the current temperature becomes higher than the melting temperature (T_m). The crystallization occurs once the current temperature becomes lower than the glass transition temperature (T_g) and the resin transforms from the crystallization to the glassy, or solid, state. The crystallization is reversible and when the material temperature exceeds T_g, the resin transforms back from the glassy to the crystallization state. Melting occurs once the current temperature becomes higher than the melting temperature (T_m) and the polymer transforms from the crystallization to the melted, state. Melting is irreversible and the crystallization is reset to 0 when the material is in the crystallization state.
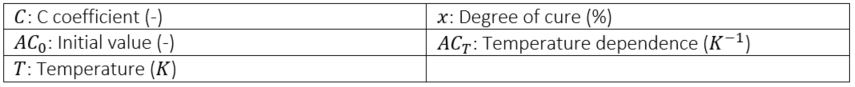
The material model within ACCS has four material states: liquid (glassy in thermoplastics), ungeled glassy (lower crystallization in thermoplastics), rubbery (higher crystallization in thermoplastics), and glassy (melted i thermoplastics) as illustrated in Figure 1. Liquid has a state value of 0, ungeled glassy of 1, rubbery of 2 and glassy of 3. In thermoplastics, glassy has a state value of -1, lower crystallization glassy of 0, higher crystallization of 1 and melted of 2. The continuous blue line corresponds to the glass temperature transition, the green line to the gelation degree of cure, and the red numbers highlight the zone where the sub-equations are valid. A smooth variation of material properties can be used by setting strictly positive values to the margins 𝑇𝑚 and 𝑥𝑚. It will linearly interpolate between the properties of the different material states according to the temperature, glass transition temperature, degree of cure (reference temperature in thermoplastics), and gelation degree of cure in thermosets and degree of crystallization in thermoplastics.
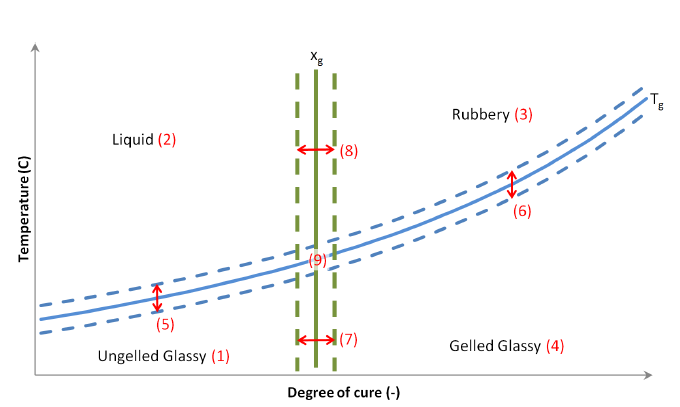
Fig. 7.2: Temperature vs. Degree of cure plot highlighting the material states
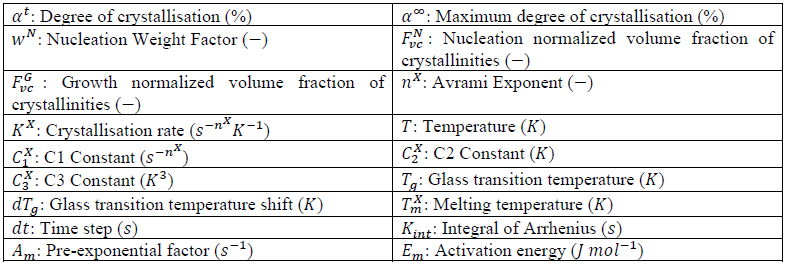
The variables used to compute the material properties are: .. image:: images/Variable_mat_prop.*
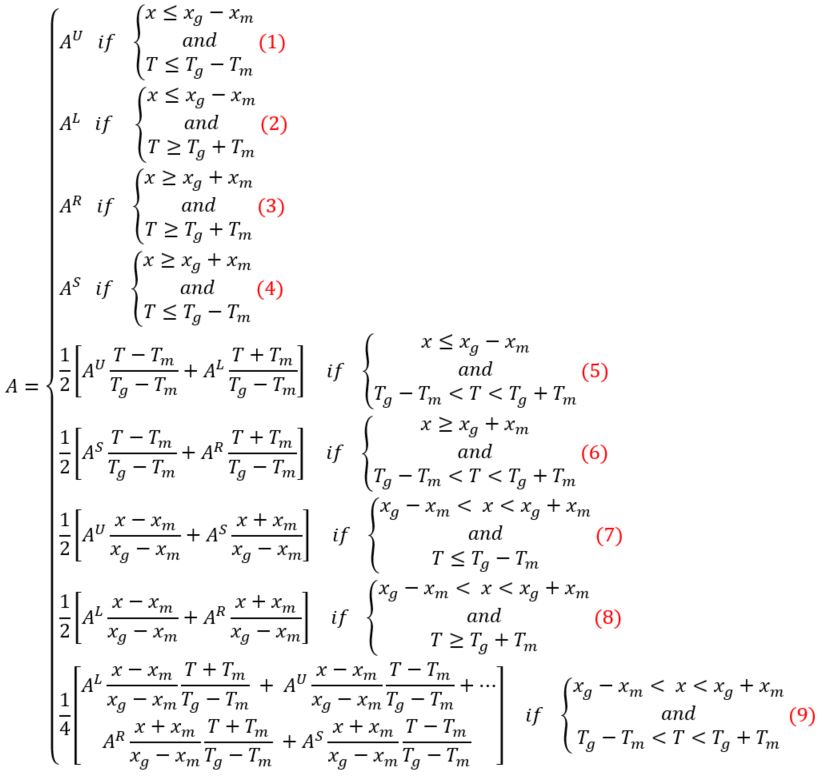
A material property named “A” have the following names in the different states: .. image:: images/A_rates.*
7.5. Supported Elements
Below are listed, the supported and tested elements. Elements outside of this list may be supported.
7.5.1. Thermal Analysis
In the following table are the thermal elements supported in ACCS:
Element number
Supported
Tested
SOLID70
YES
NO
SOLID87
YES
NO
SOLID90
YES
NO
SOLID278
YES
YES
SOLID 279
YES
YES
Note: Elements SOLID70, SOLID87, and SOLID90 are changed to their SOLID278/SOLID279 equivalents for materials with curing properties.
7.5.2. Structural Analysis
In the following table are the structural elements supported in ACCS:
Element number
Supported
Tested
SOLID65
YES
NO
LINK180
YES
NO
SHELL181
YES
NO
PLANE182
YES
NO
PLANE183
YES
NO
SOLID185
YES
YES
SOLID186
YES
YES
SOLID187
YES
NO
BEAM188
YES
NO
BEAM189
YES
NO
SOLSH190
YES
NO
SHELL208
YES
NO
SHELL209
YES
NO
SOLID223
YES
SOLID226
YES
SOLID227
YES
REINF263
YES
NO
REINF264
YES
NO
REINF265
YES
NO
SOLID272
YES
NO
SOLID273
YES
NO
SOLID278
YES
NO
SOLID279
YES
NO
SHELL281
YES
NO
SOLID285
YES
NO
PIPE288
YES
NO
PIPE289
YES
NO
ELBOW290
YES
NO